Left-Brained Me finds the subjective feeling of an application’s “snappiness” an uncomfortable metric to use, at least when compared to more objective application performance metrics. Nevertheless, when multiple colleagues mention, in passing, that they’ve perceived a reduction in Universal Snappiness Index in the past few days… well, I see that as good reason to go look at some charts.
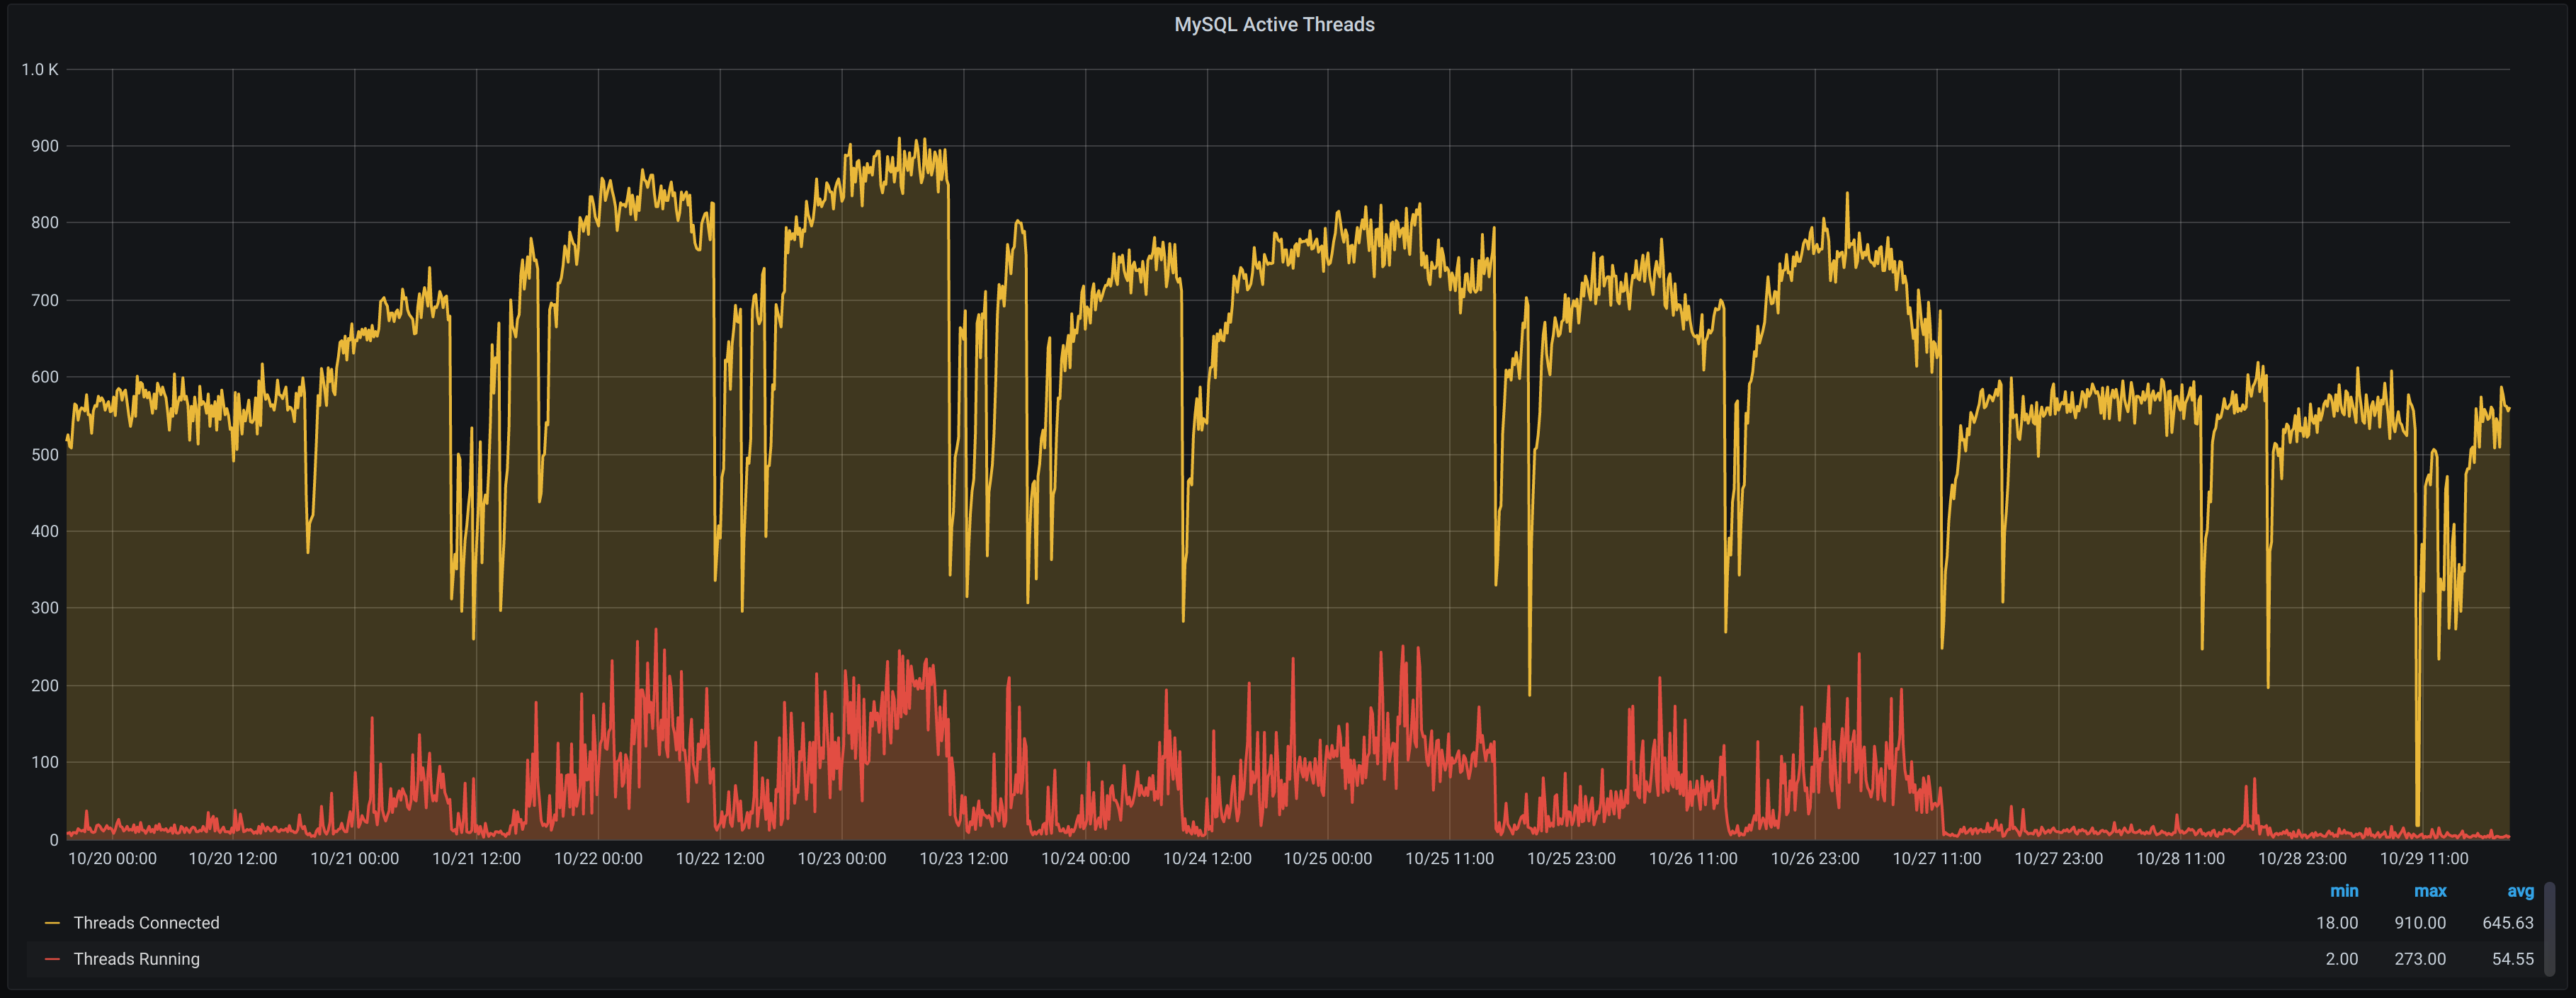
Now, metrics are only as good as the ones you were collecting before you had a problem (hence my call to arms to drop everything), so in this case it’s a good thing there was already a pretty robust monitoring stack set up. In our case, our database servers feed Prometheus with data (via mysqld_exporter), which can then be visualised in Grafana. With this, I was able to see the exact point at which The Snappening occurred.
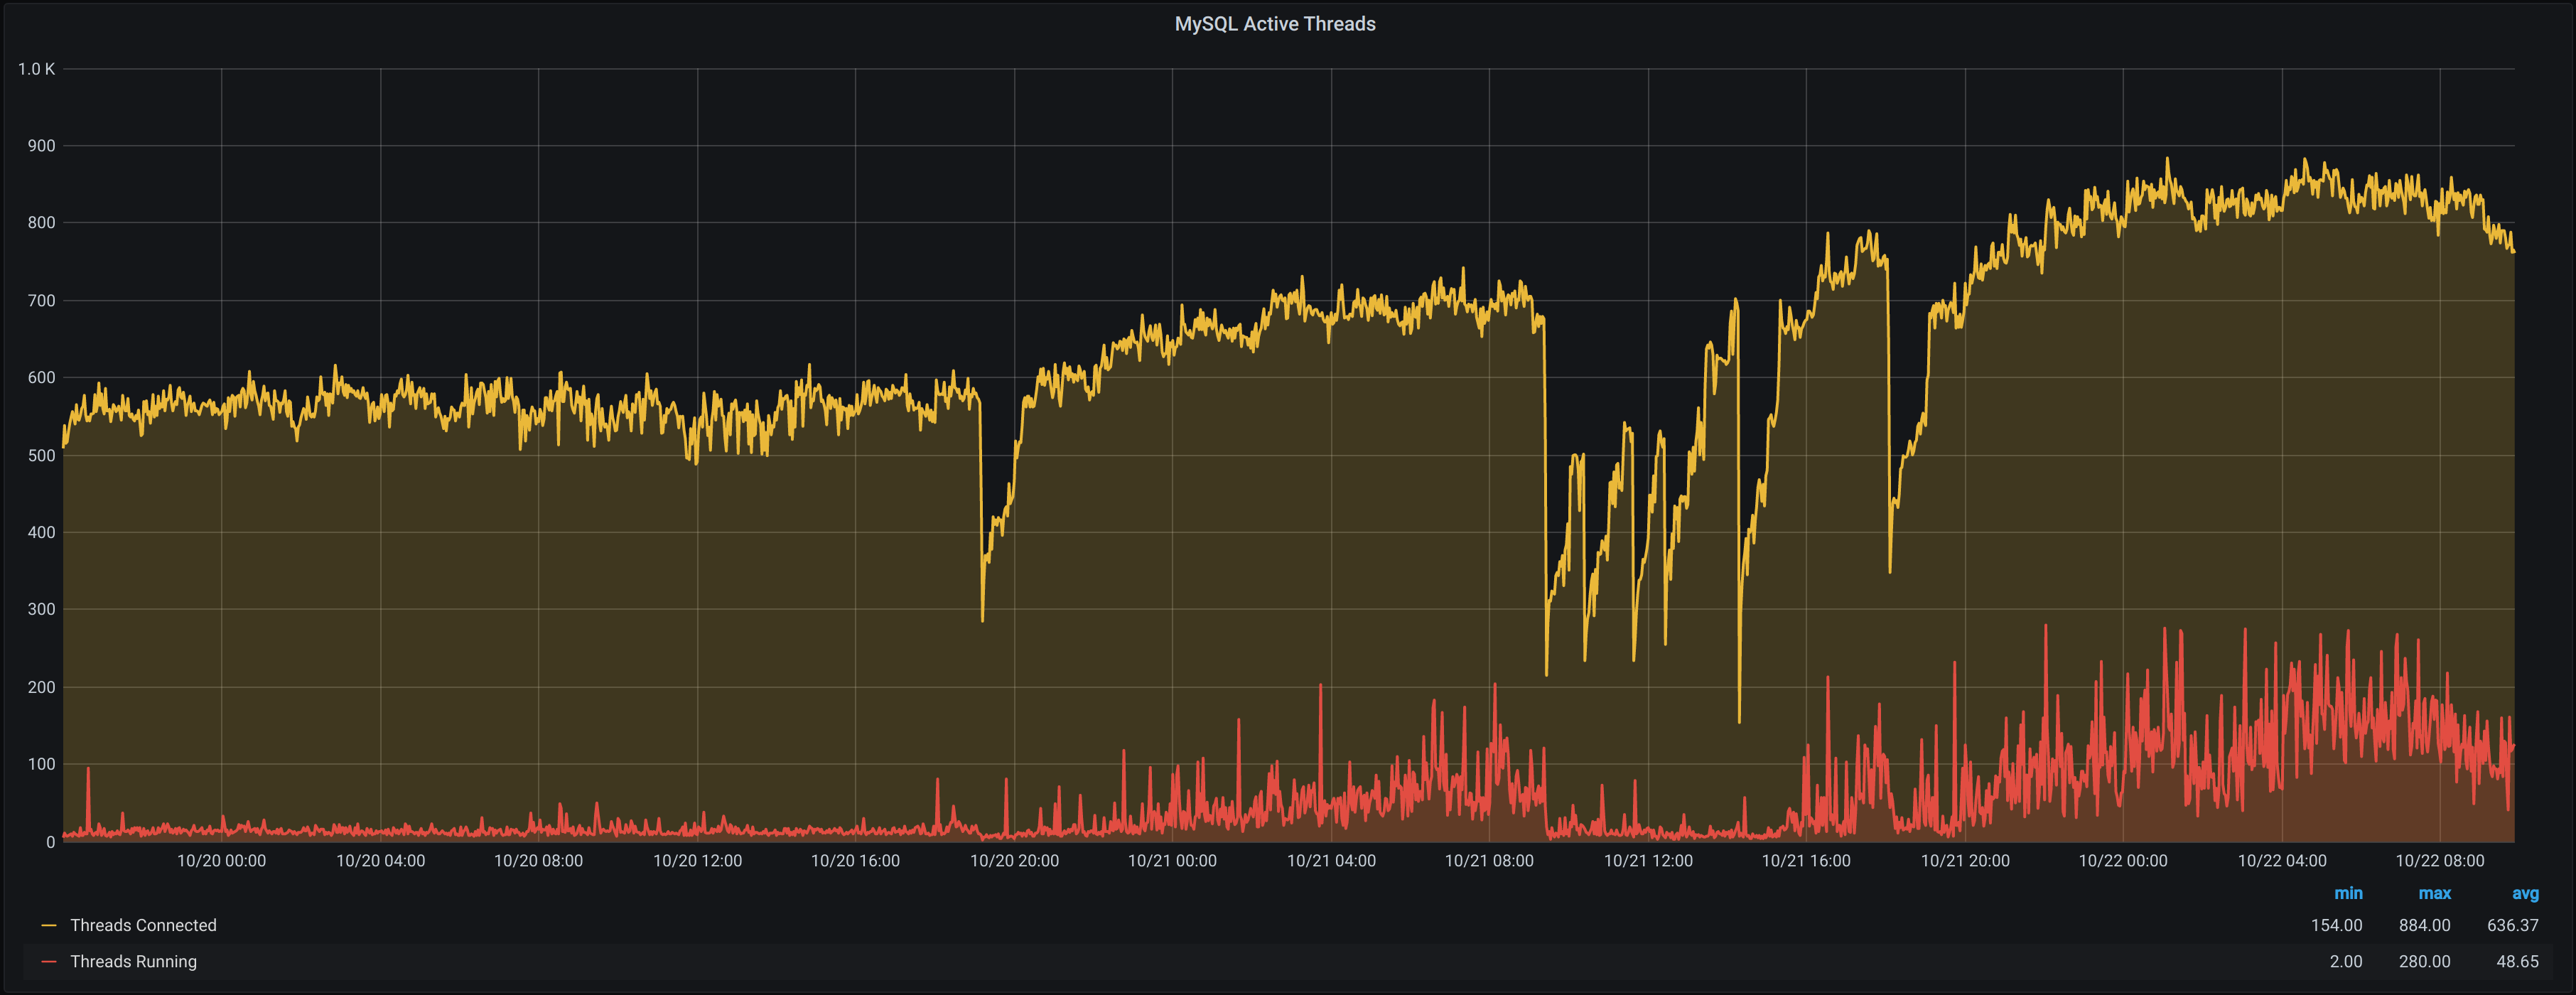
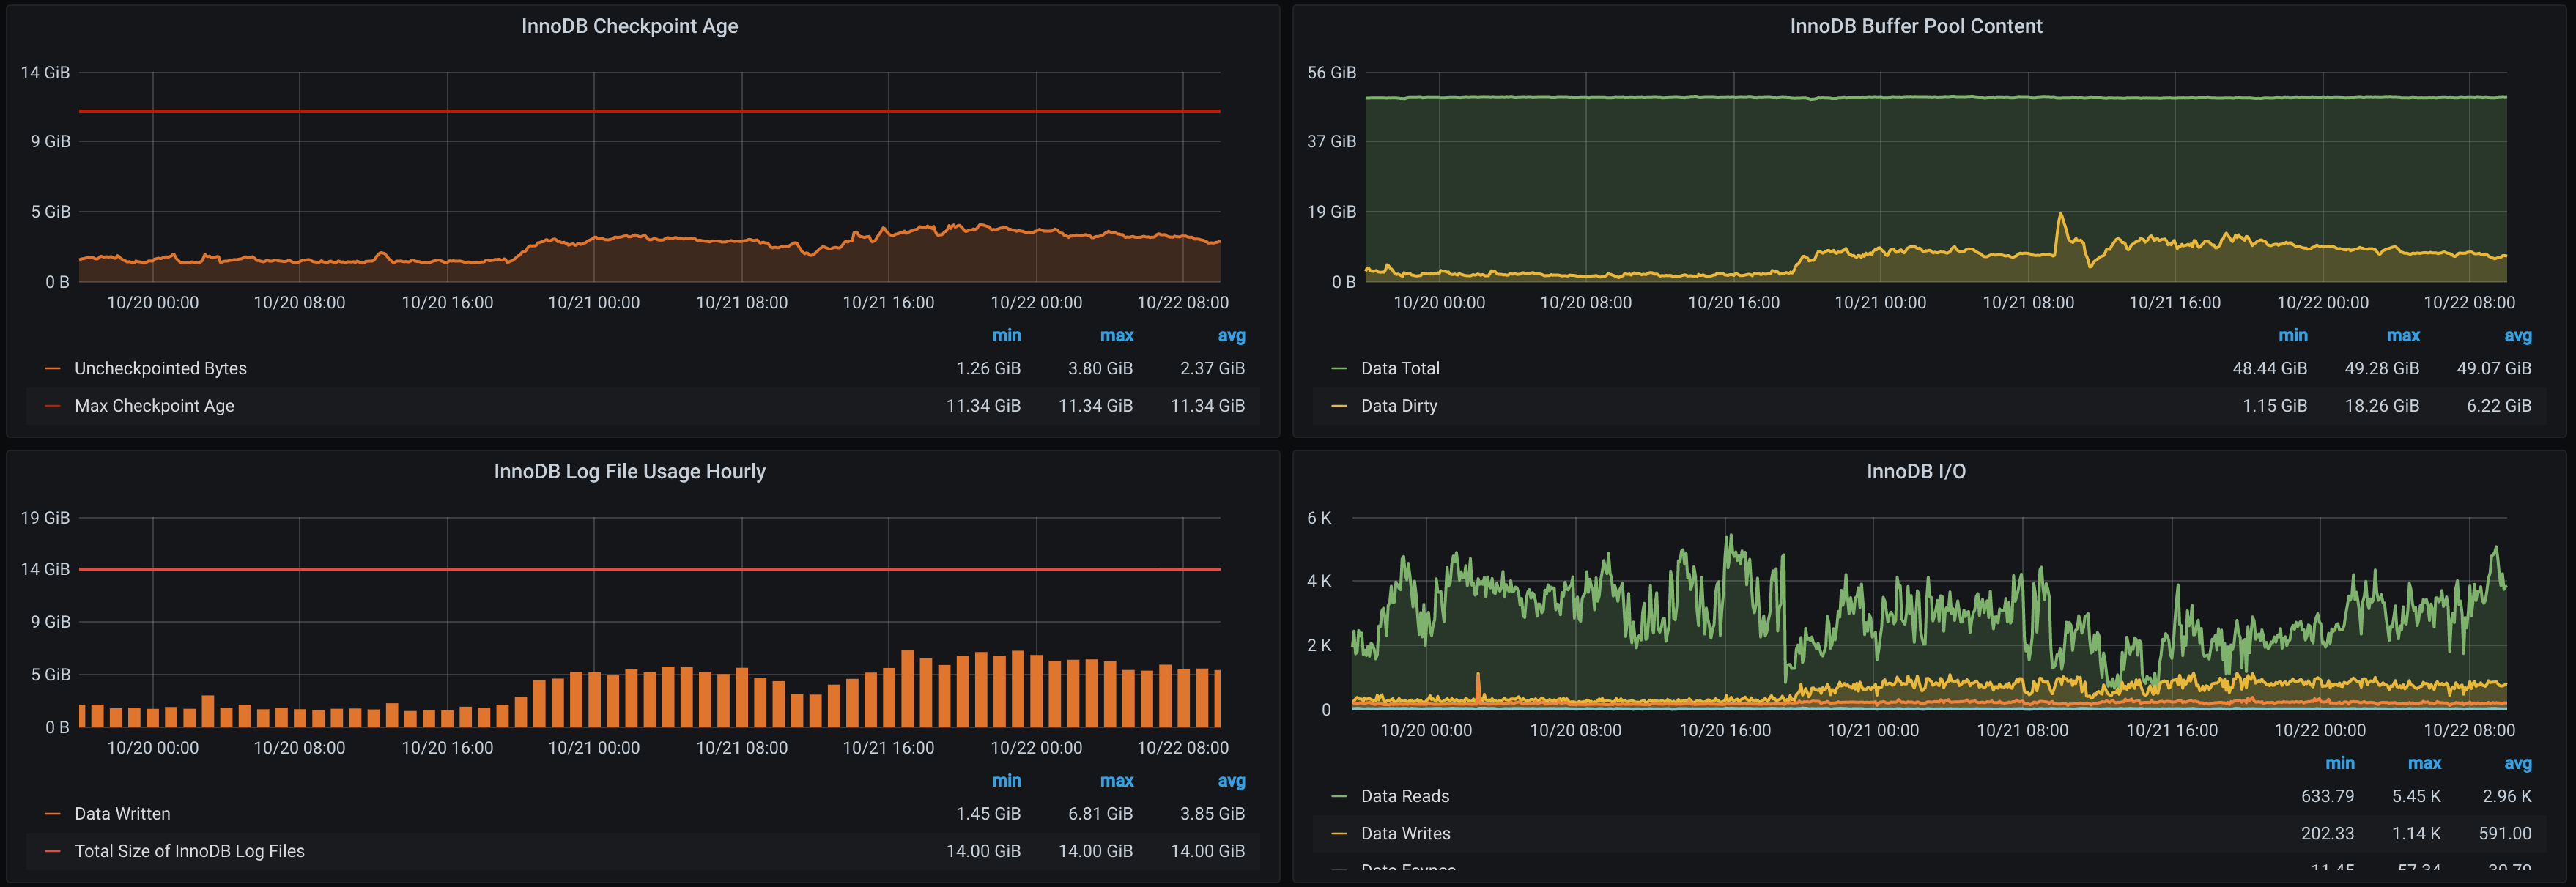
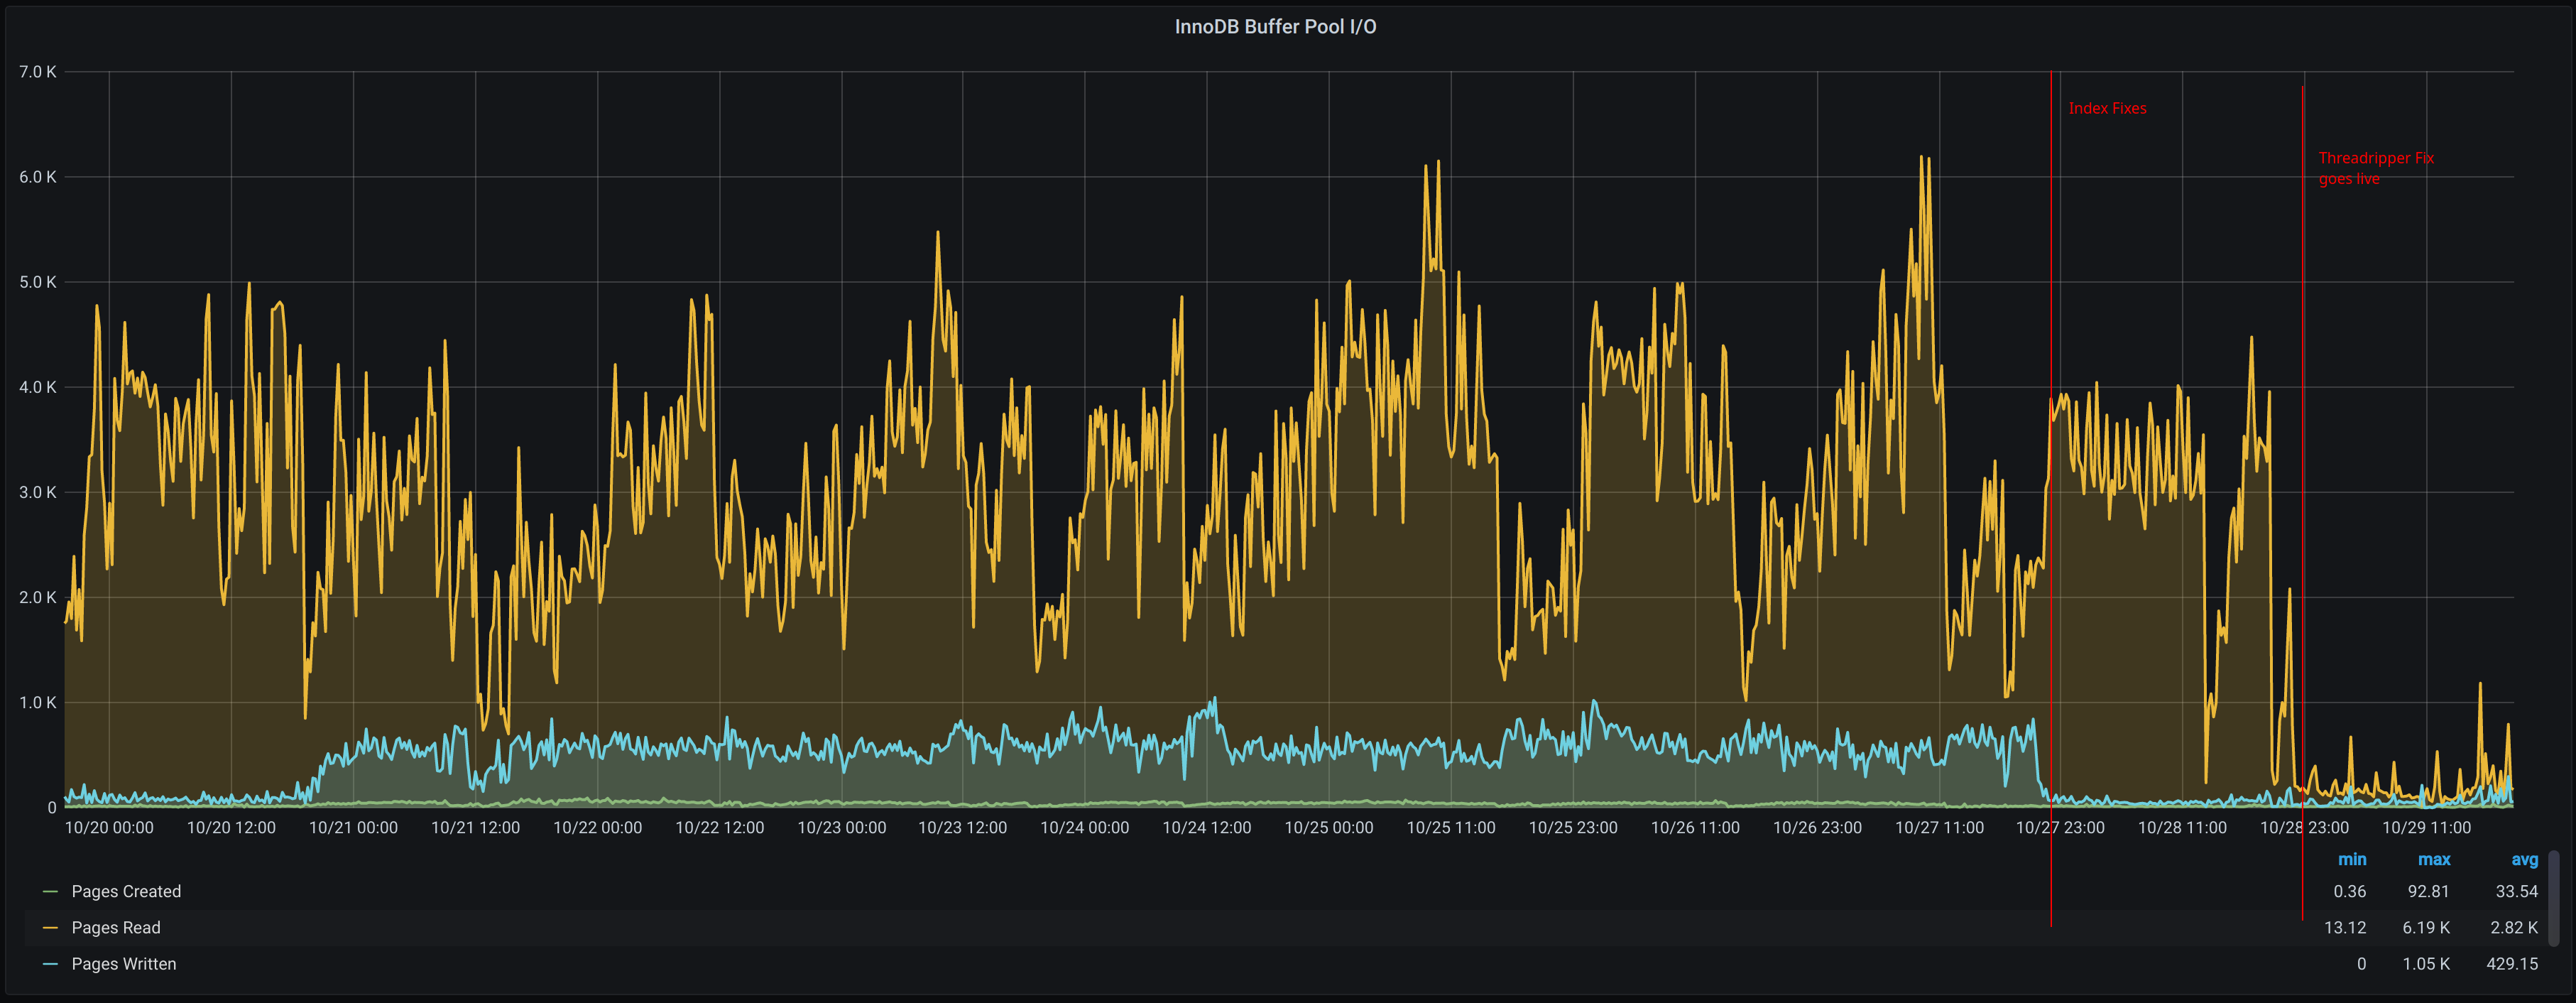
We were also able to correlate this with an increased amount of exceptions caused by MySQL deadlocks. While these aren’t usually helpful in identifying a problem, as they are often a tell-tale symptom rather than the root cause, they do tend to indicate that we have a high row lock time somewhere. Moreover, InnoDB statistics tells us that we’re seeing a particular issue with writes; this is particularly visible when looking at the number of uncheckpointed bytes and in the dirty buffer pool content.
Looking through the deployments made that day, nothing seemed like it could have obviously created this issue. While we did make a couple of changes in the hope that they would improve things, we needed more information to be able to improve performance.
Enter PMM
Those graphs we were looking at already come from Percona’s Grafana plugin, but Percona themselves now offer a newer tool for looking at MySQL performance: PMM1, which caught my eye with its Query Analytics2 feature.
Interesting, says I. I should integrate this into our existing monitoring stack, says I. 🤔
Several hours, 3 litres of coffee, a whiskey sour, and countless curse words later, I had not integrated this into our existing monitoring stack, and instead had set up a new monitoring stack solely for PMM3. Nevertheless, we were able to start reaping its benefits almost immediately.
While it’s tempting to start with the queries at the top of PMM’s naughty list, it’s important to focus on the specific problem to solve. Other stuff may not be performant, but that’s not important if it predates the issue we’re looking into - I’m trying to get us back to the original baseline, further improvements can come later. Bearing in mind the issues of deadlocks and write performance, I started by using QAN’s search to filter for INSERT and UPDATE queries. While I ought not to share the specific queries at fault, let’s generalise about some of the issues we were able to fix with this data.
E_TOO_MANY_INDEXES
When we start out building an application, especially as less-experienced engineers, indexes are often an afterthought. After a certain amount of scale, and associated performance hit, it becomes obvious how important they can be, at which point a mad scramble is made to create as many as possible, and their virtues are extolled from the rooftops4.
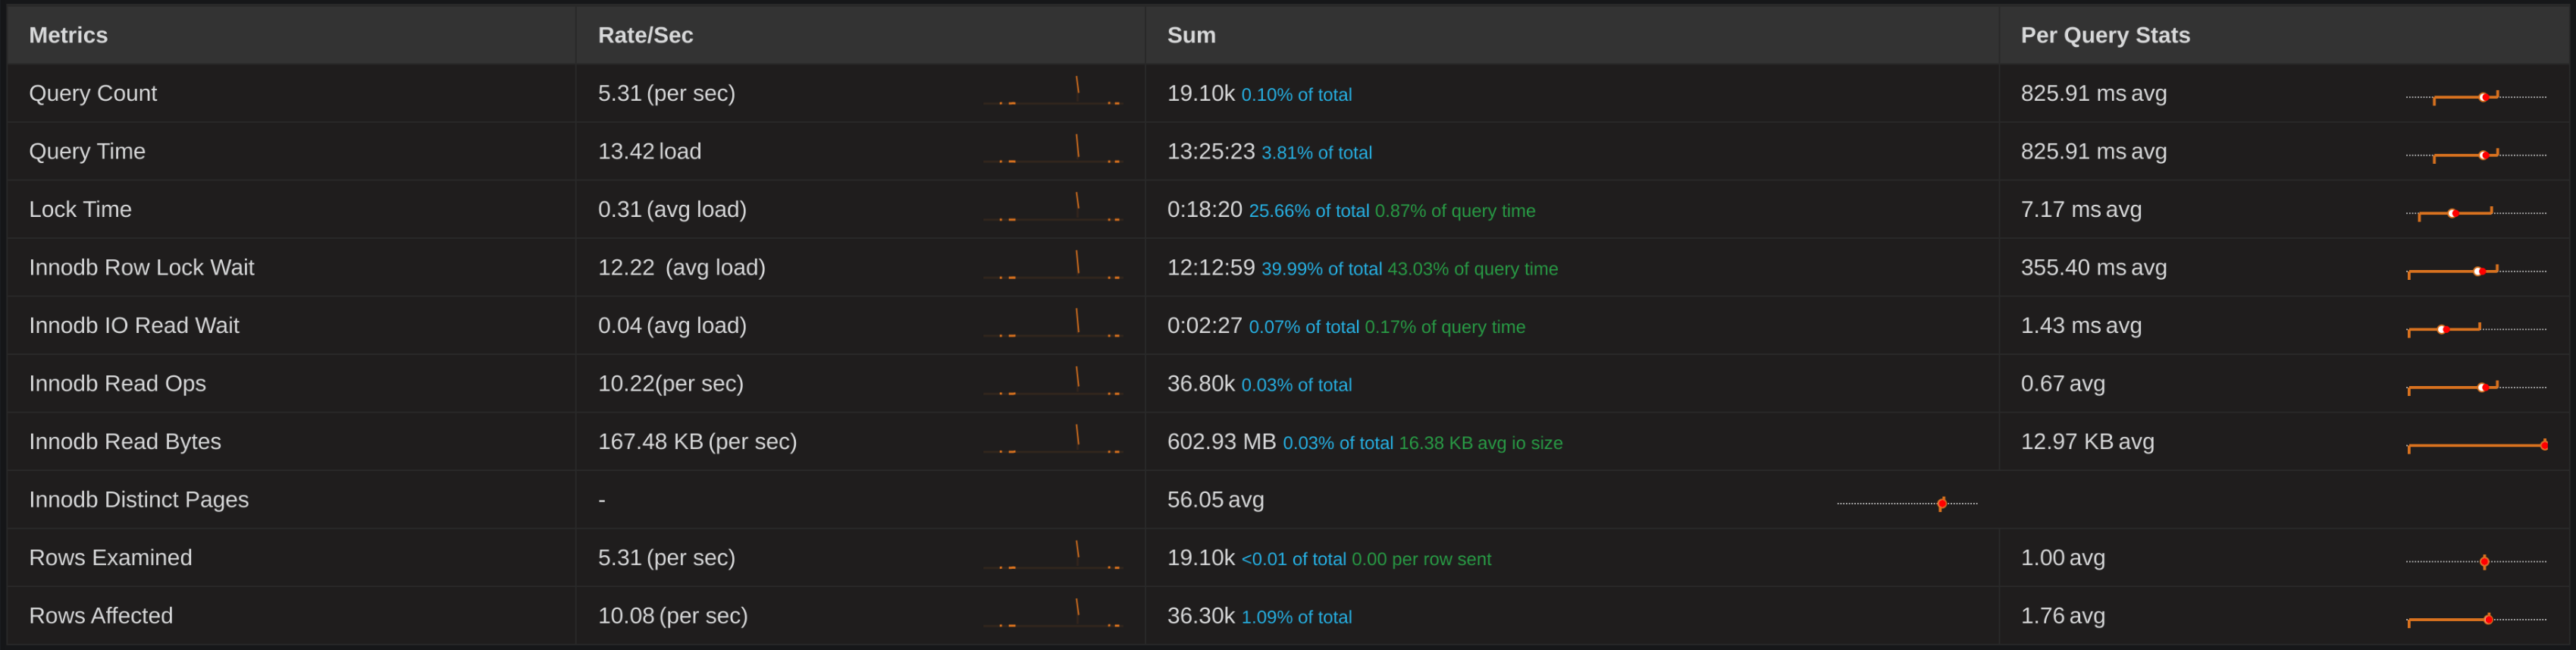
Of course, while indexes can dramatically increase read performance, that can come with a corresponding penalty to write performance. That was no more so than on one of our largest (schema-wise) and most-used tables, which clocked in at a grand total of 15 indexes. PMM highlighted the performance issue here:
This query’s lock time combined with its frequency made it a good place to start. I decided to see if there were any indexes in that table that were not used, via the following query:
-- Query courtesy of https://federico-razzoli.com/dropping-useless-mysql-indexes
SELECT st.TABLE_SCHEMA, st.TABLE_NAME, st.INDEX_NAME
    FROM information_schema.STATISTICS st
    LEFT JOIN information_schema.INDEX_STATISTICS idx
        ON  idx.INDEX_NAME    = st.INDEX_NAME
        AND idx.TABLE_NAME    = st.TABLE_NAME
        AND idx.TABLE_SCHEMA  = st.TABLE_SCHEMA
    WHERE
        (idx.INDEX_NAME IS NULL OR idx.ROWS_READ = 0)
        AND st.NON_UNIQUE = 1
    ORDER BY 1, 2, 3
;
This showed us that 5 of those 15 indexes could just go, giving us an immediate boost in write performance for free! And we had highlighted several more indexes that were also unused and could be cleaned up in a similar fashion. 293, to be exact. 😅
Here’s another good example. Look at this little guy. Innocuous enough, right?
DELETE FROM `table`
WHERE `table`.`foreign_key` = ?
       AND `table`.`foreign_key` is NOT null
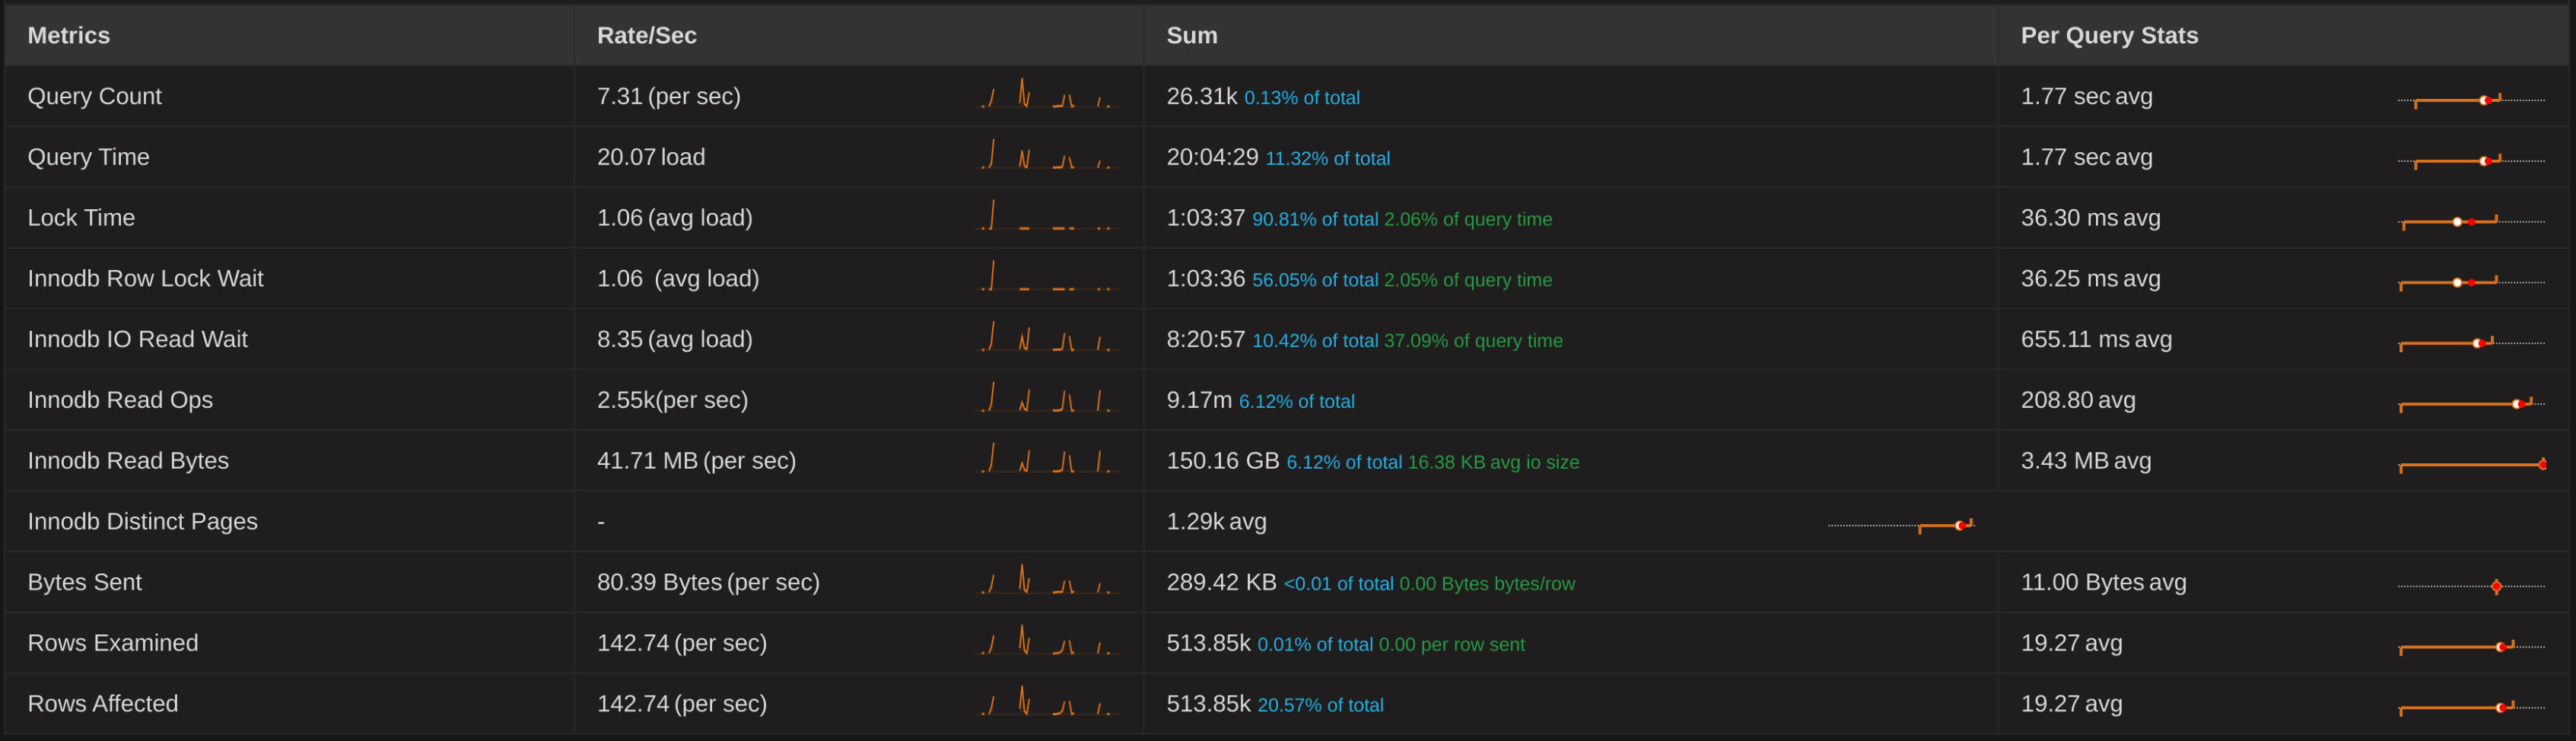
Given the 5 indexes on this table, this query was actually quite the young offender:
The fix for this was slightly different: two of those indexes could be deleted and replaced with an extra attribute on a composite key. Again, free performance!
With these changes alone complete, we were almost back at our original baseline performance.
But, much like when you take the can of WD-40 out to fix a squeaky cupboard, only to prowl the house looking for anything that makes the slightest sound, the can of PMM was now in hand, and I commenced prowling the database looking for any squeaky queries.
E_WE_HAVE_TO_GO_DEEPER
Looking at the list of top queries in PMM, one stuck out immediately:
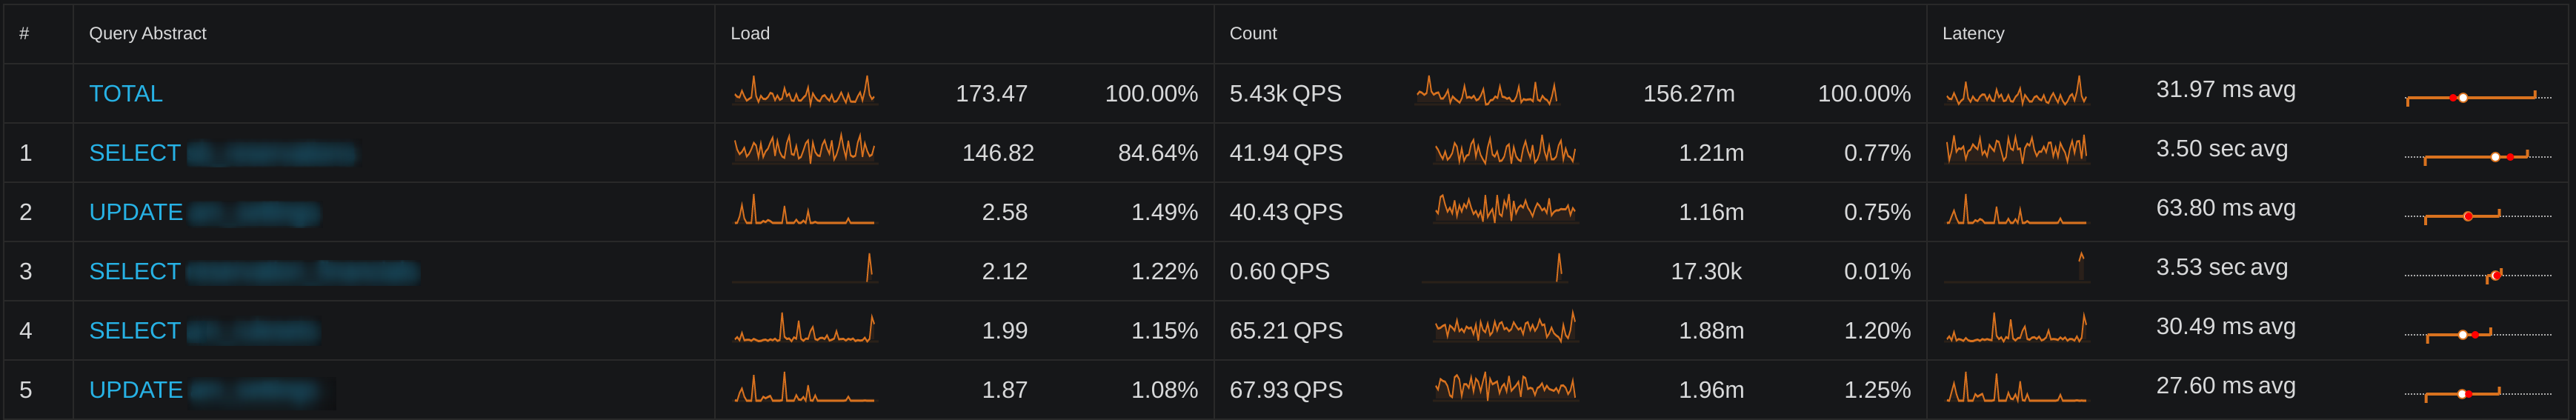
Can you spot it?
Yep, that’s a single query, run 40 times per second, that accounts for over 84% of our database load! 🤯
With an average execution time of over 3 seconds, and that frequency, this thing eats CPU threads for breakfast. Let’s call him the Threadripper.
I originally didn’t focus on this query because a) it’s a SELECT and I was looking into write performance, and b) I know it’s old as balls and therefore hasn’t contributed to the recent issues. It’s been slow since these other queries were learnin’ to crawl.
Such a query must surely be a beast! Several hundred lines long, subqueries on top of subqueries on top of every type of join under the sun!
SELECT *
FROM `reservations`
WHERE `user_id` = ?
       AND `status` in(?+)
        AND `starts_at` >= ?
        AND `created_at` >= ?
        AND `reservations`.`deleted_at` is null
Oh, is that it?
The fix for this particular query was, again, a compound index; while the table in question had several indexes for the individual columns, managing index cardinality was key for a performant SELECT.
Lovely Flat Charts(QAN, apparently)nappiness Index_ increased across the board:
And as for our InnoDB buffer? That chart is even more vivid:
Takeaways
So what did we learn?
- We learned that, without having metrics and observability in pace before there’s an issue, you might as well be using tea leaves to find your performance bottlenecks.
- We learned that we should not be content for the status to continue to quo; there’s probably older, systemic issues that can be fixed if you just have the tooling to spot them.
- We learned that indexes are neither good nor bad: we would never have been able to optimise them without a deep understanding of our domain model and what particular columns / combinations of columns are important to our business.
And what could have gone better?
- It took a significant performance penalty, which had a knock-on effect on customers, for us to begin looking into this issue, where frankly we had some underlying problem queries that could have benefitted from some love long long ago.
- We didn’t catch this as it happened, instead relying on reports from colleagues and customers that subjective “snappiness” was down. This is why, as you’ll see above, we were experiencing performance issues over a number of days, rather than us all being able to jump on this as it happened.
Moving forwards, we have the tools in place (PMM) to be able to investigate database-related performance issues much more thoroughly, and we’ll be setting up Grafana to post to Slack based on certain chart thresholds, hopefully allowing us to catch this kind of stuff more readily in future.